Why Should We Monitor?
Deployment isn’t the end of a feature’s journey. We need to continuously monitor whether users are using it as intended, if there are any bugs missed during QA, and how well it integrates with existing features.
One of the most important things, in my opinion, is that monitoring should be convenient. It’s great if it’s aesthetically pleasing, but above all, it must be easy to use. User frustration can stem from various sources.
After developing and maintaining a product for several years, you’ll see all kinds of customer support (CS) complaints:
- It’s slow.
- It doesn’t work as expected.
- Something looks off.
- There’s an error.
If these CS requests come in when you’re unprepared with monitoring tools, the developer in charge will be left dumbfounded. You’ll have to make an educated guess based on your experience and knowledge. This often leads to a lengthy process of asking the user for more information, trying to reproduce the issue, and ultimately, a lot of personal inconvenience.
Beyond CS requests, if you want to improve the performance of your product but don’t have monitoring tools, it’s hard to even know where to start.
To put it in one sentence, the reason we need to use monitoring tools effectively is to improve our metacognition. If you’re aware of how different parts of your product are functioning, it becomes much easier to know what to do when you need to fix a bug or make an improvement.
What to Look for in Datadog RUM?
It’s best to start by investigating one area of interest at a time.
Performance Metrics
Performance Monitoring Page
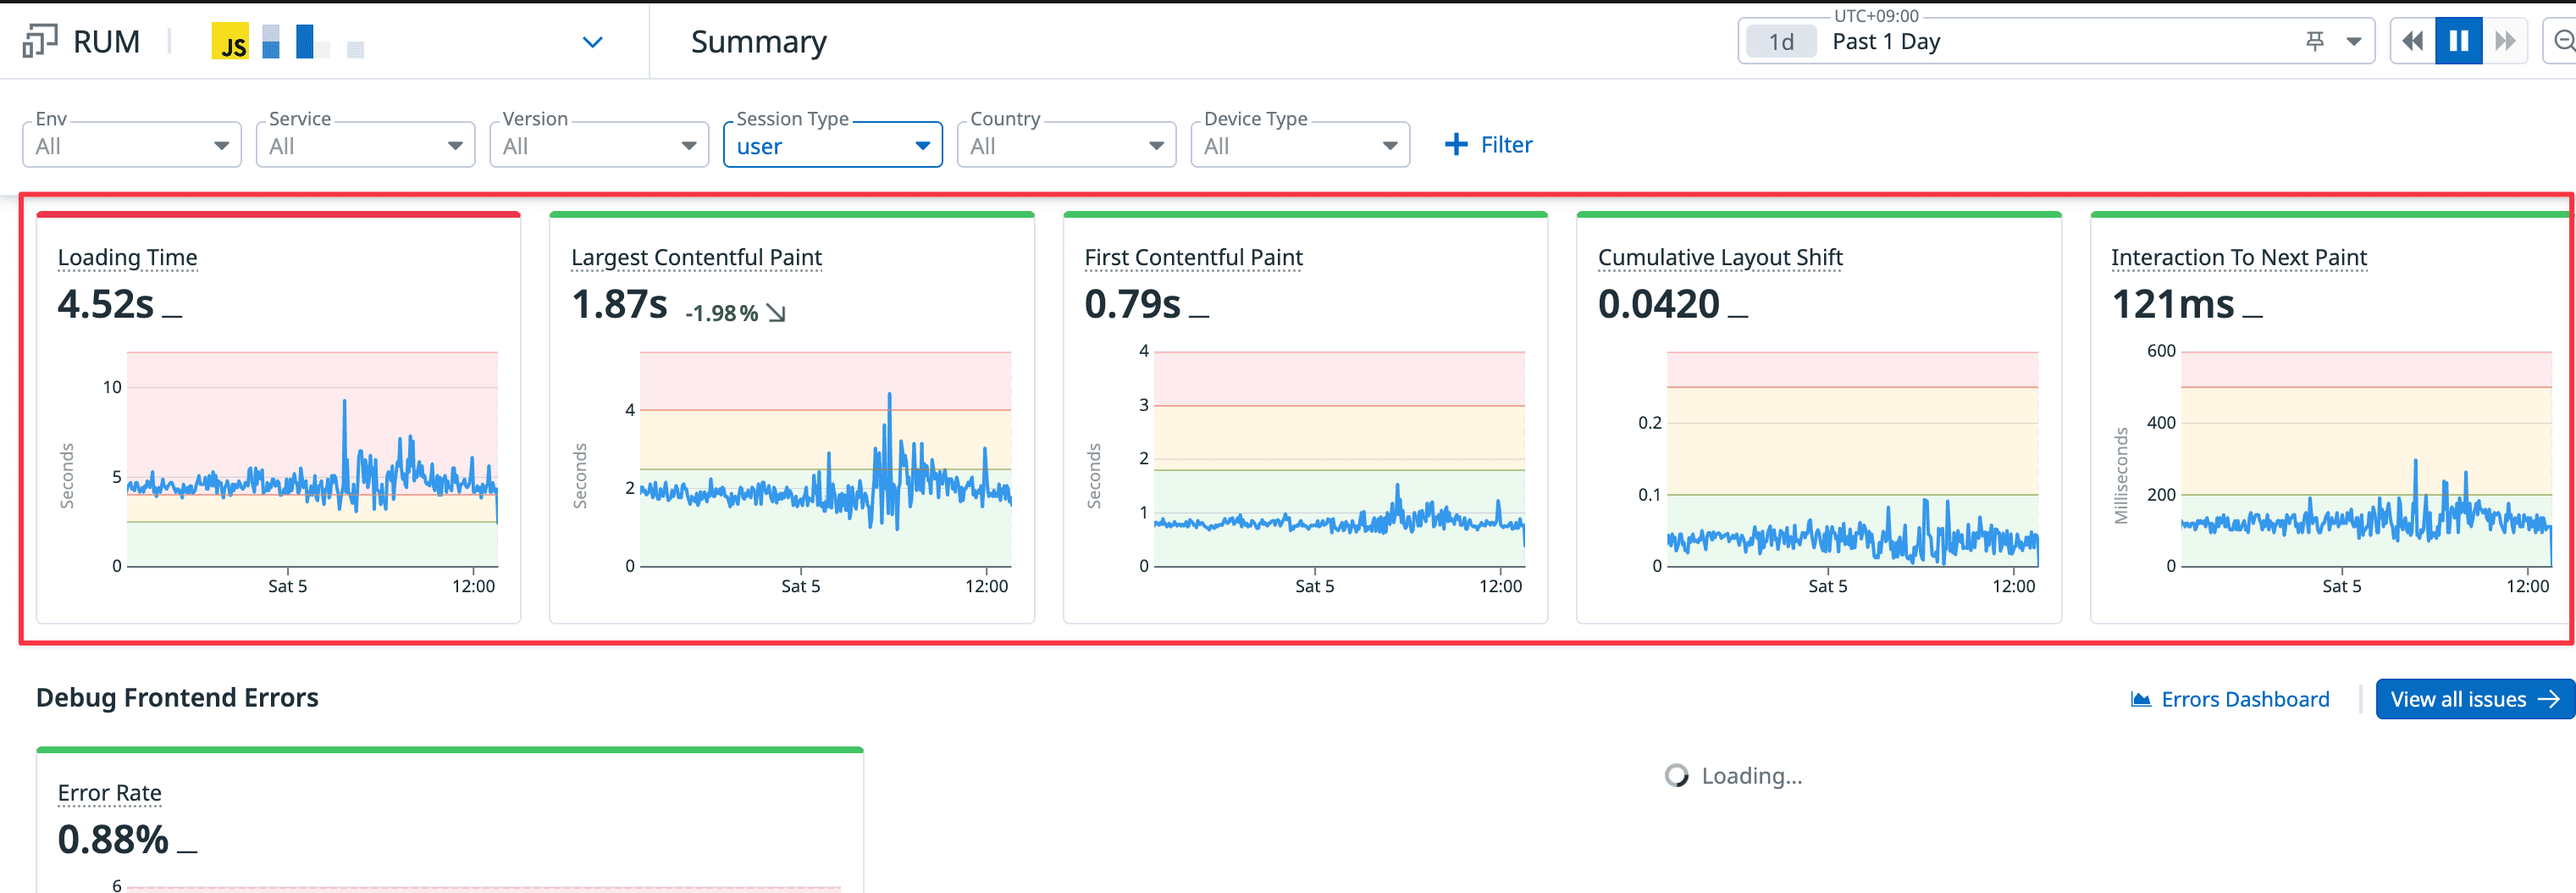
Simply by using RUM, you get site-wide Web Vitals for each Application ID.
- You can apply various filters for specific pages, devices, and environments.
- You can set the time range in the top right to see how things have changed over time.
- You can track each metric over time.
- Naturally, you can see slowdowns during peak usage hours.
- This helps you identify which APIs are vulnerable to overload and prioritize which ones to optimize for speed.
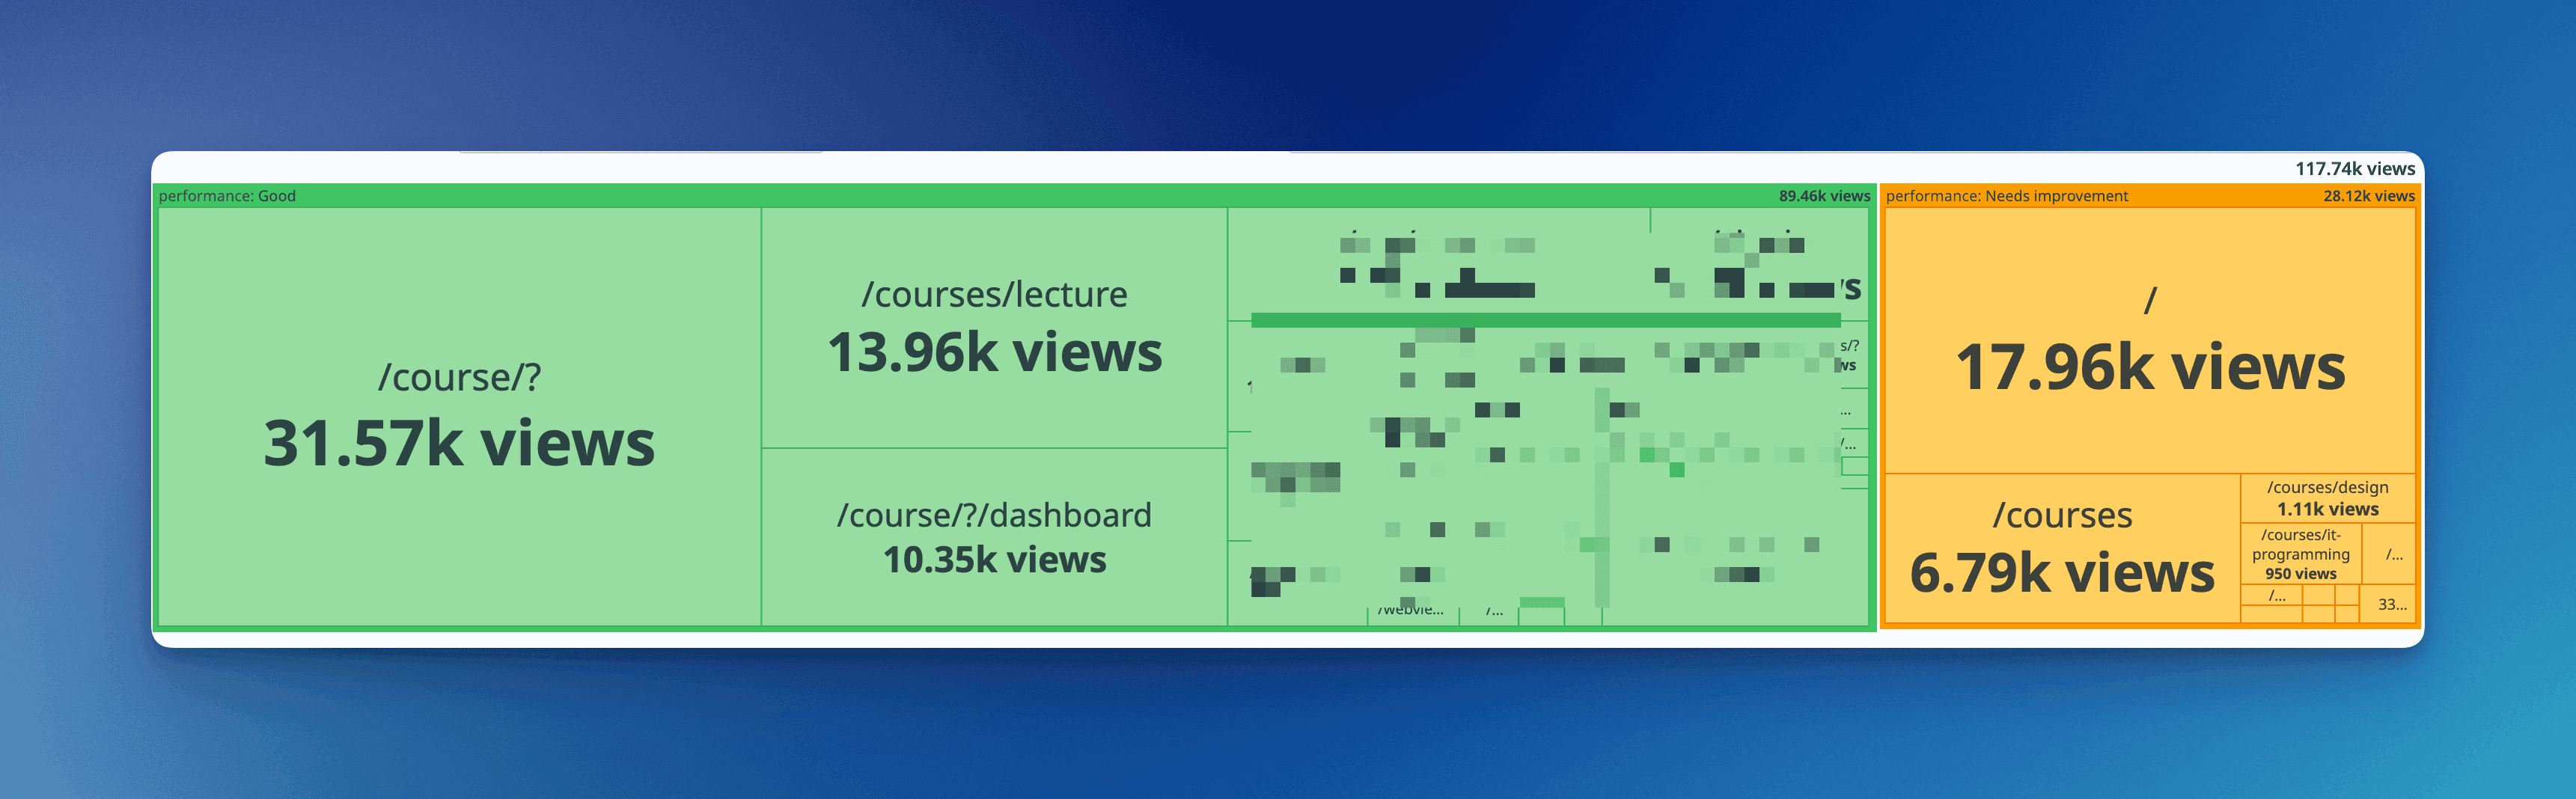
- The area below the chart also shows performance by path.
Finding Slow Images and Resources
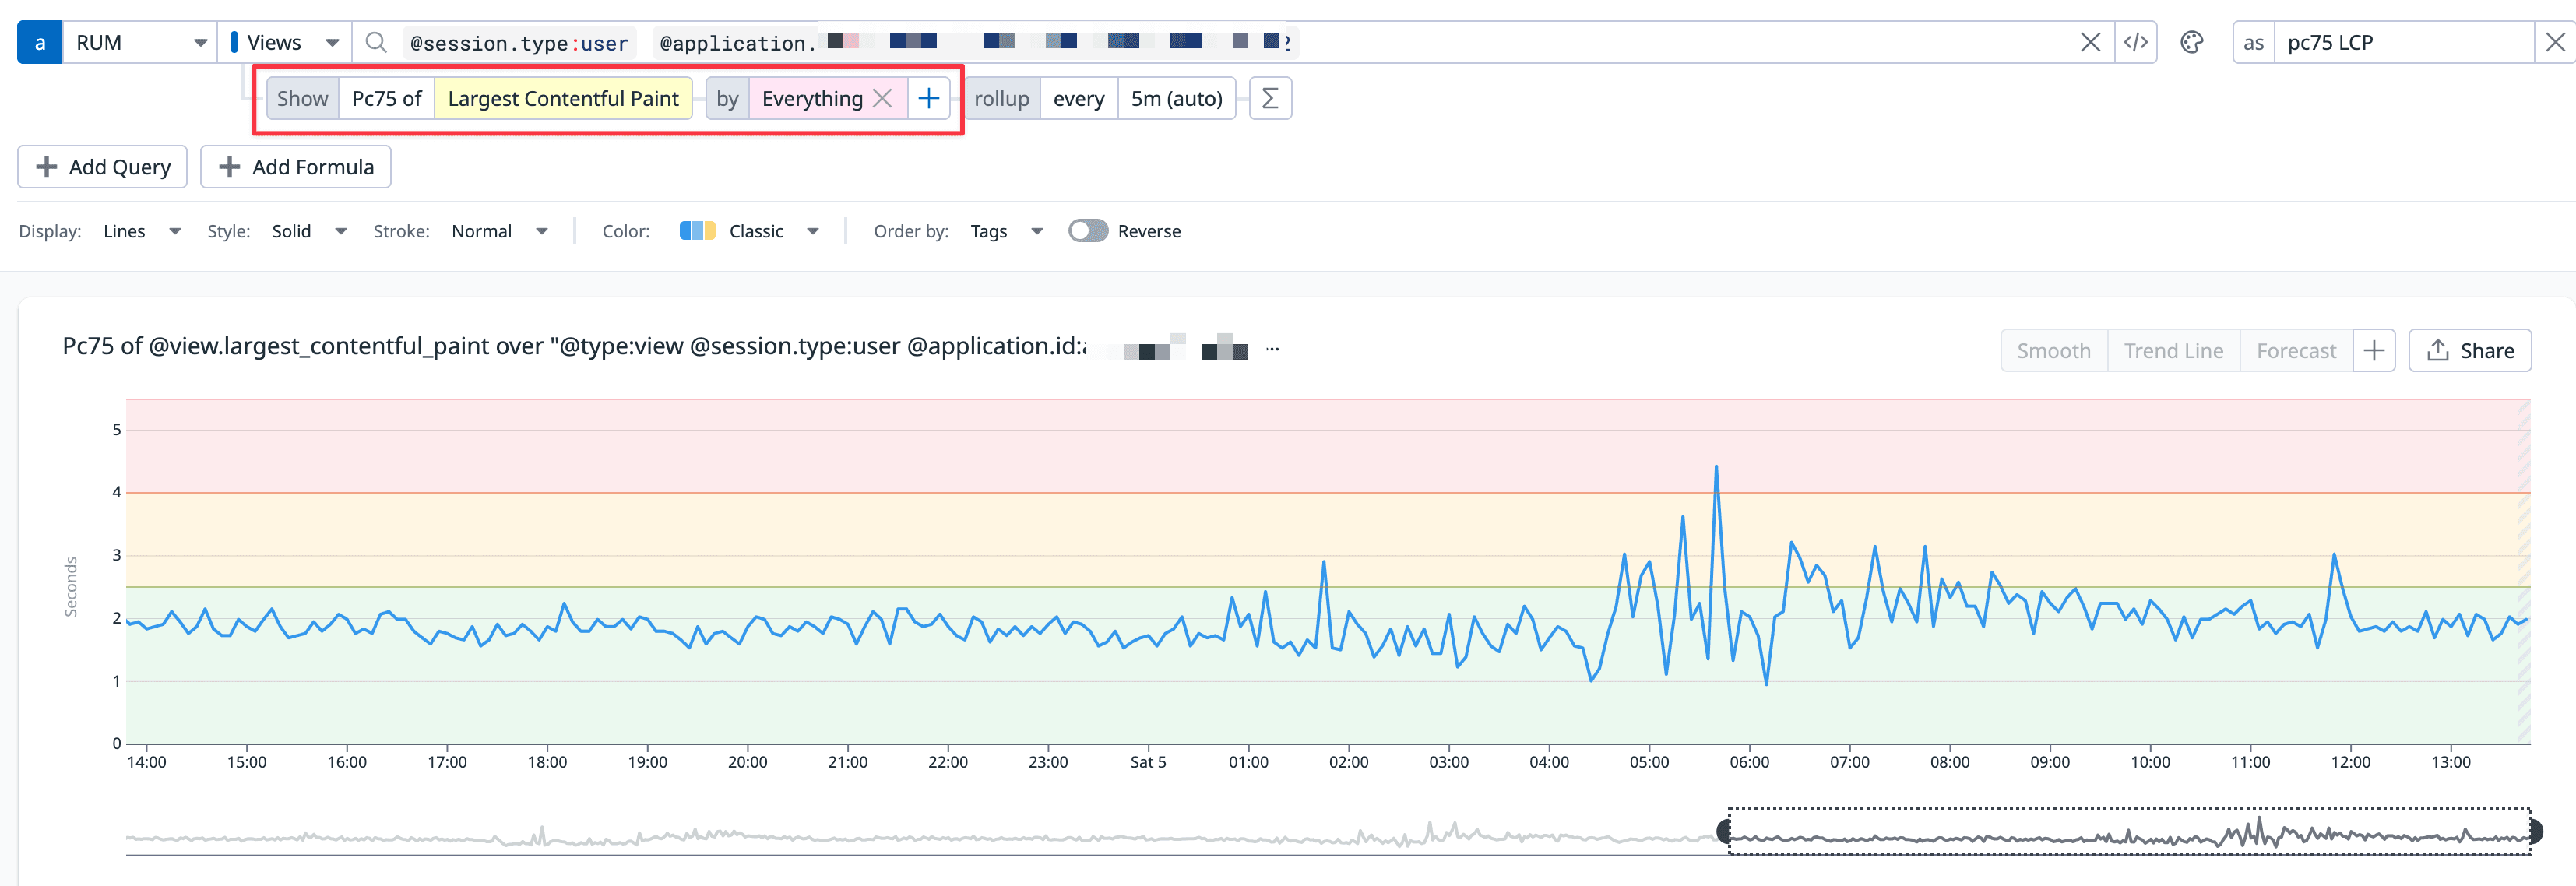 You can create your own filters using the same Datadog query format used to display Web Vitals. (The default sections on the Performance Monitoring page are also powered by Datadog queries).
If your company’s service is based on user-generated content, it’s crucial for that content to load quickly. If you’ve set the trackResources option to true in your Datadog RUM configuration, it automatically records the speed of each request based on the PerformanceResourceTiming API.
You can query this data using @resource related metrics. While it stores a lot of information, I primarily use @resource.duration (the total time to load a resource) and @resource.size (the size of the resource).
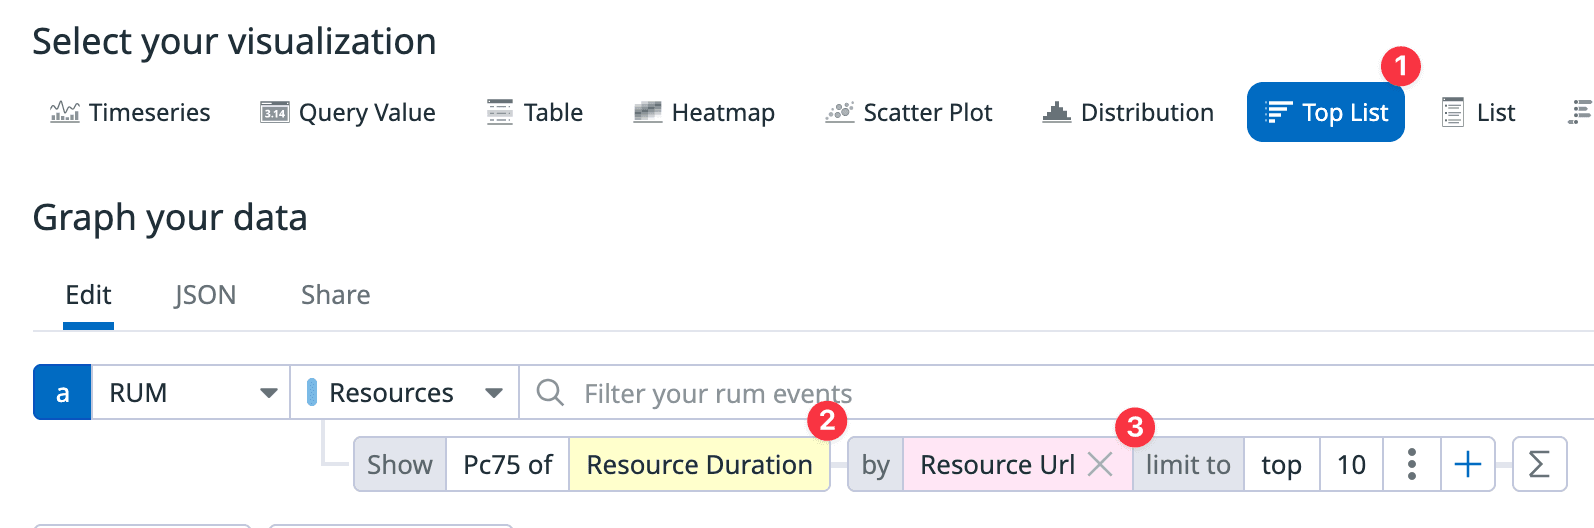
- Set the visualization type to
Top List. - Set the metric to resource load time.
- Group by resource URL and sort in descending order.
Now you can see which requests are the slowest on your site. When I first set up this filter, I was surprised to find that an unexpected resource was the slowest request. Since our service involves user-generated content, there are frequent copy-pastes, which led to an external CDN being one of the slowest requests. (We discussed how to handle these external CDN resources, but we decided to skip it for now as it wasn’t a critical issue and only affected a small portion of users).
Monitoring like this constantly improves my metacognition about the product by revealing what I didn’t know.
Errors
Bugs are bound to cause errors in a production environment. I believe it’s easier to respond quickly when a problem occurs than to try and prevent every single one perfectly. Here’s the process I followed to respond to errors quickly:
- Record as many errors as possible.
- Ideally, you’d have a perfect response plan for every error from the start, but that’s not realistic.
- Use the Monitors feature to get alerts (e.g., in Slack) when errors exceed a certain threshold within a specific time frame (e.g., 5 minutes).
- Check every error alert that comes through on Slack.
- If you’ve enabled the Session Replay option to record user actions, it’s easier to figure out what caused an error and whether it actually affected the user experience.
- However, this comes at a high cost. A free alternative is Microsoft’s Clarity.
- After a while, you’ll start to see patterns in errors and CS requests. Use these patterns to refine your error alerts.
- Make it easier to distinguish errors by type.
- For high-cardinality data, include it with the error.
- For example, if you’re using
shaka-player, including the video playback error code and environment details in the error object can help with root cause analysis.
- For example, if you’re using
- Set up separate monitors for different error types and adjust the alert thresholds accordingly.
- If alerts are too frequent, developers can become desensitized.
- Use the
beforeSendoption to prevent unnecessary alerts from being sent to Datadog.
- Use the
For more information on error monitoring, see here…
Service Analytics
Product Analytics Page
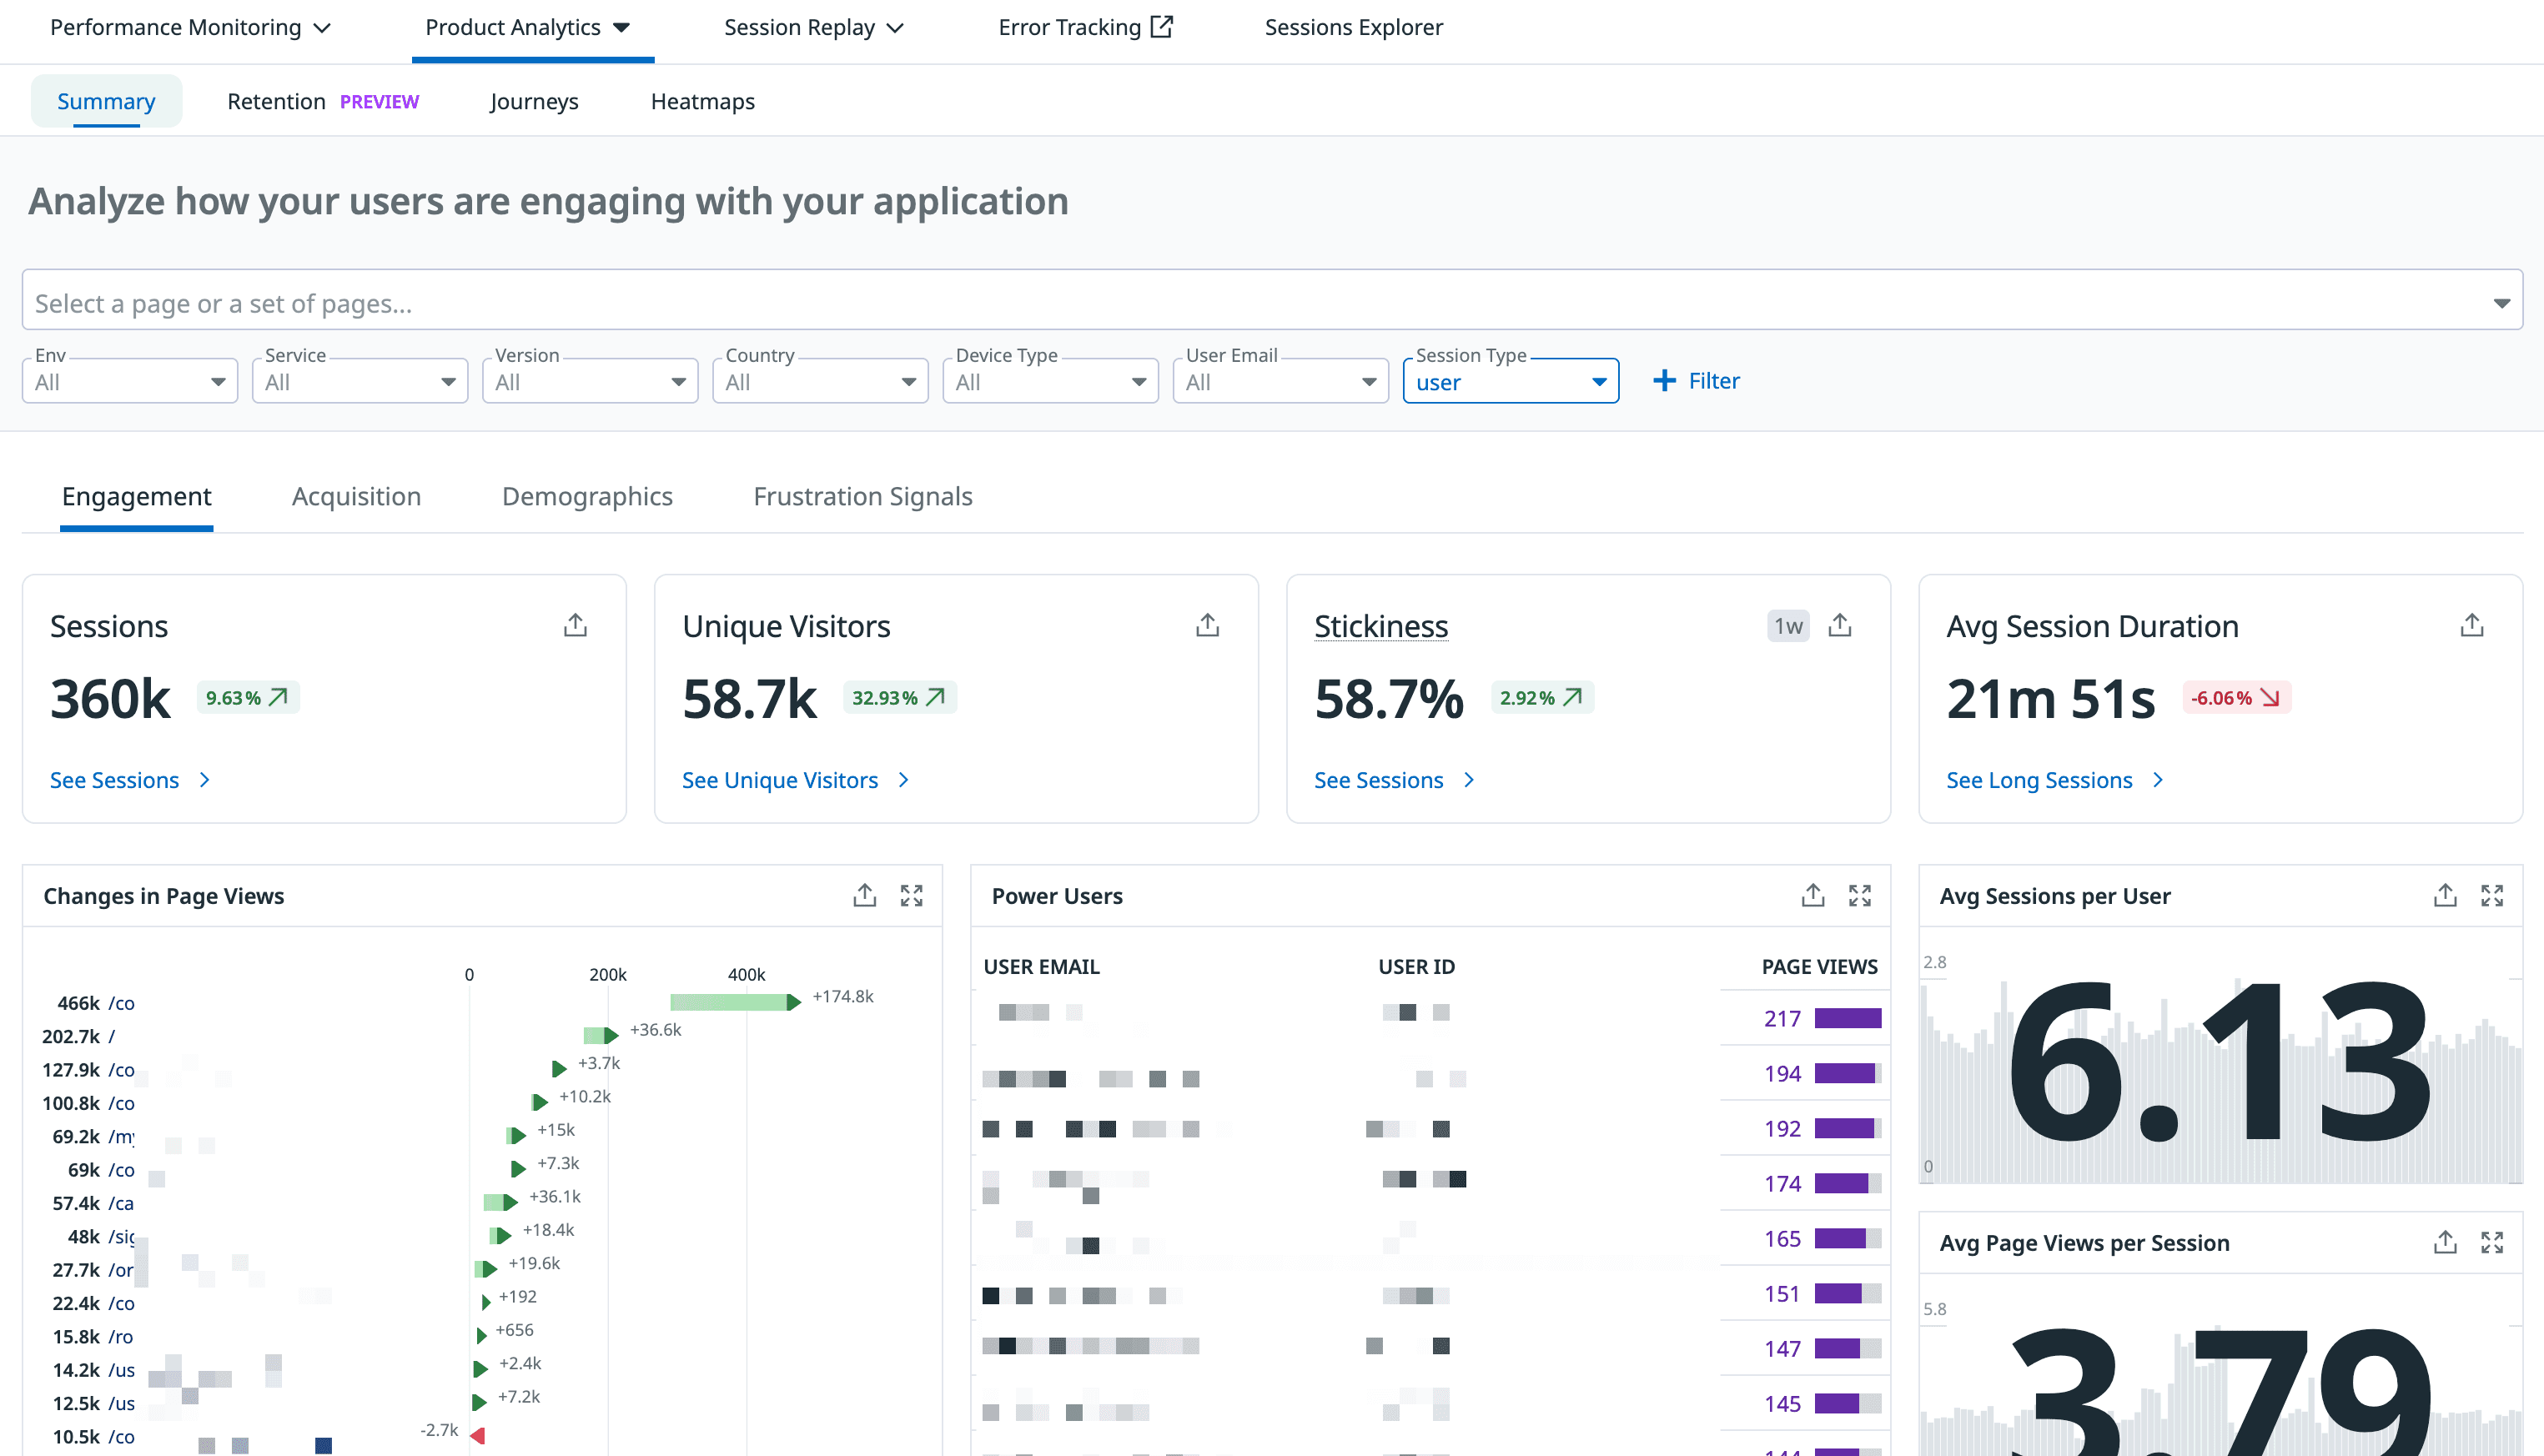
This page provides a single view of whether users are using the product as intended, which pages are most popular, which buttons are clicked most often, and more. This information can also be filtered by various conditions.
I once used this feature to check the average time users spent on a learning page. Interestingly, regardless of the OS or browser, the average time converged to about 50 minutes. It made me realize there’s a reason why school classes are typically set at around 50 minutes.
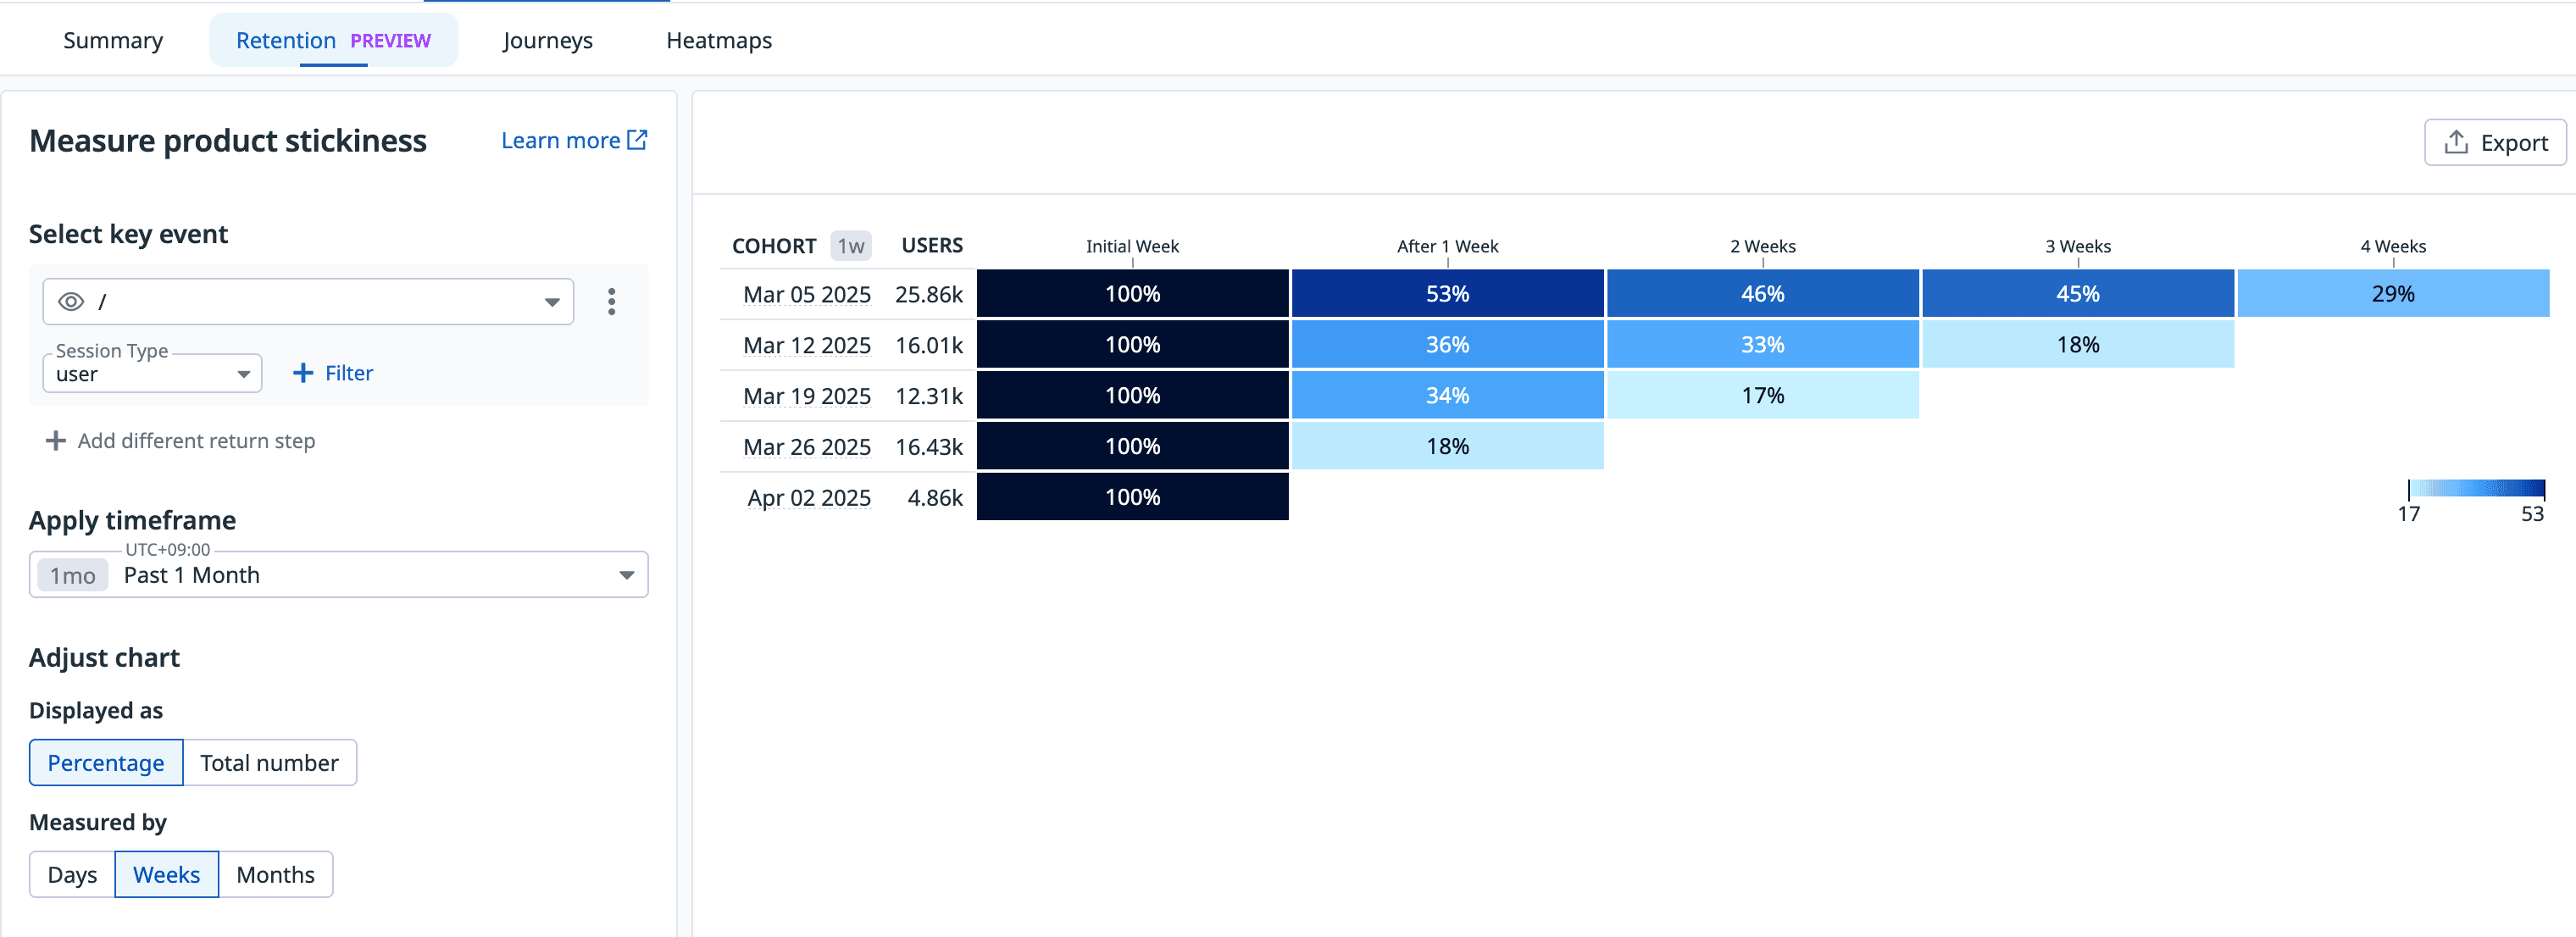
The retention page shows user retention for specific paths, which you can filter by different time periods.